From 2021 to 2022, Medicare Advantage enrollment grew 9% and the program now accounts for 48% of all seniors on Medicare. If the rate of growth continues, by 2030 Medicare Advantage will serve 70% of the Medicare population.
A frequently stated explanation for MA’s growth is related to the new menu of supplemental benefits. Supplemental benefits have appealed to several groups. For age-ins who may not have urgent needs for health services, over-the-counter drug benefits, and complementary medicine have encouraged MA enrollment. For similar reasons and because broad PPO networks with out-of-network benefits are now commonly available, late-to-Medicare seniors have also begun joining MA plans more frequently.
Special programs such as Special Supplemental Benefits for Chronically Ill (SSBCI) also make a contribution to MA’s overall trajectory. For example, as a program, SSBCI has shown particularly strong growth. Between 2020 and 2022, enrollment in SSBCI plans grew by 3.3 million. Evidence of the attractiveness of this business is shown by the growth in the number of plans offering these benefits. Today 23% of MA plans offer at least one SSBCI, up from 6% two years ago.
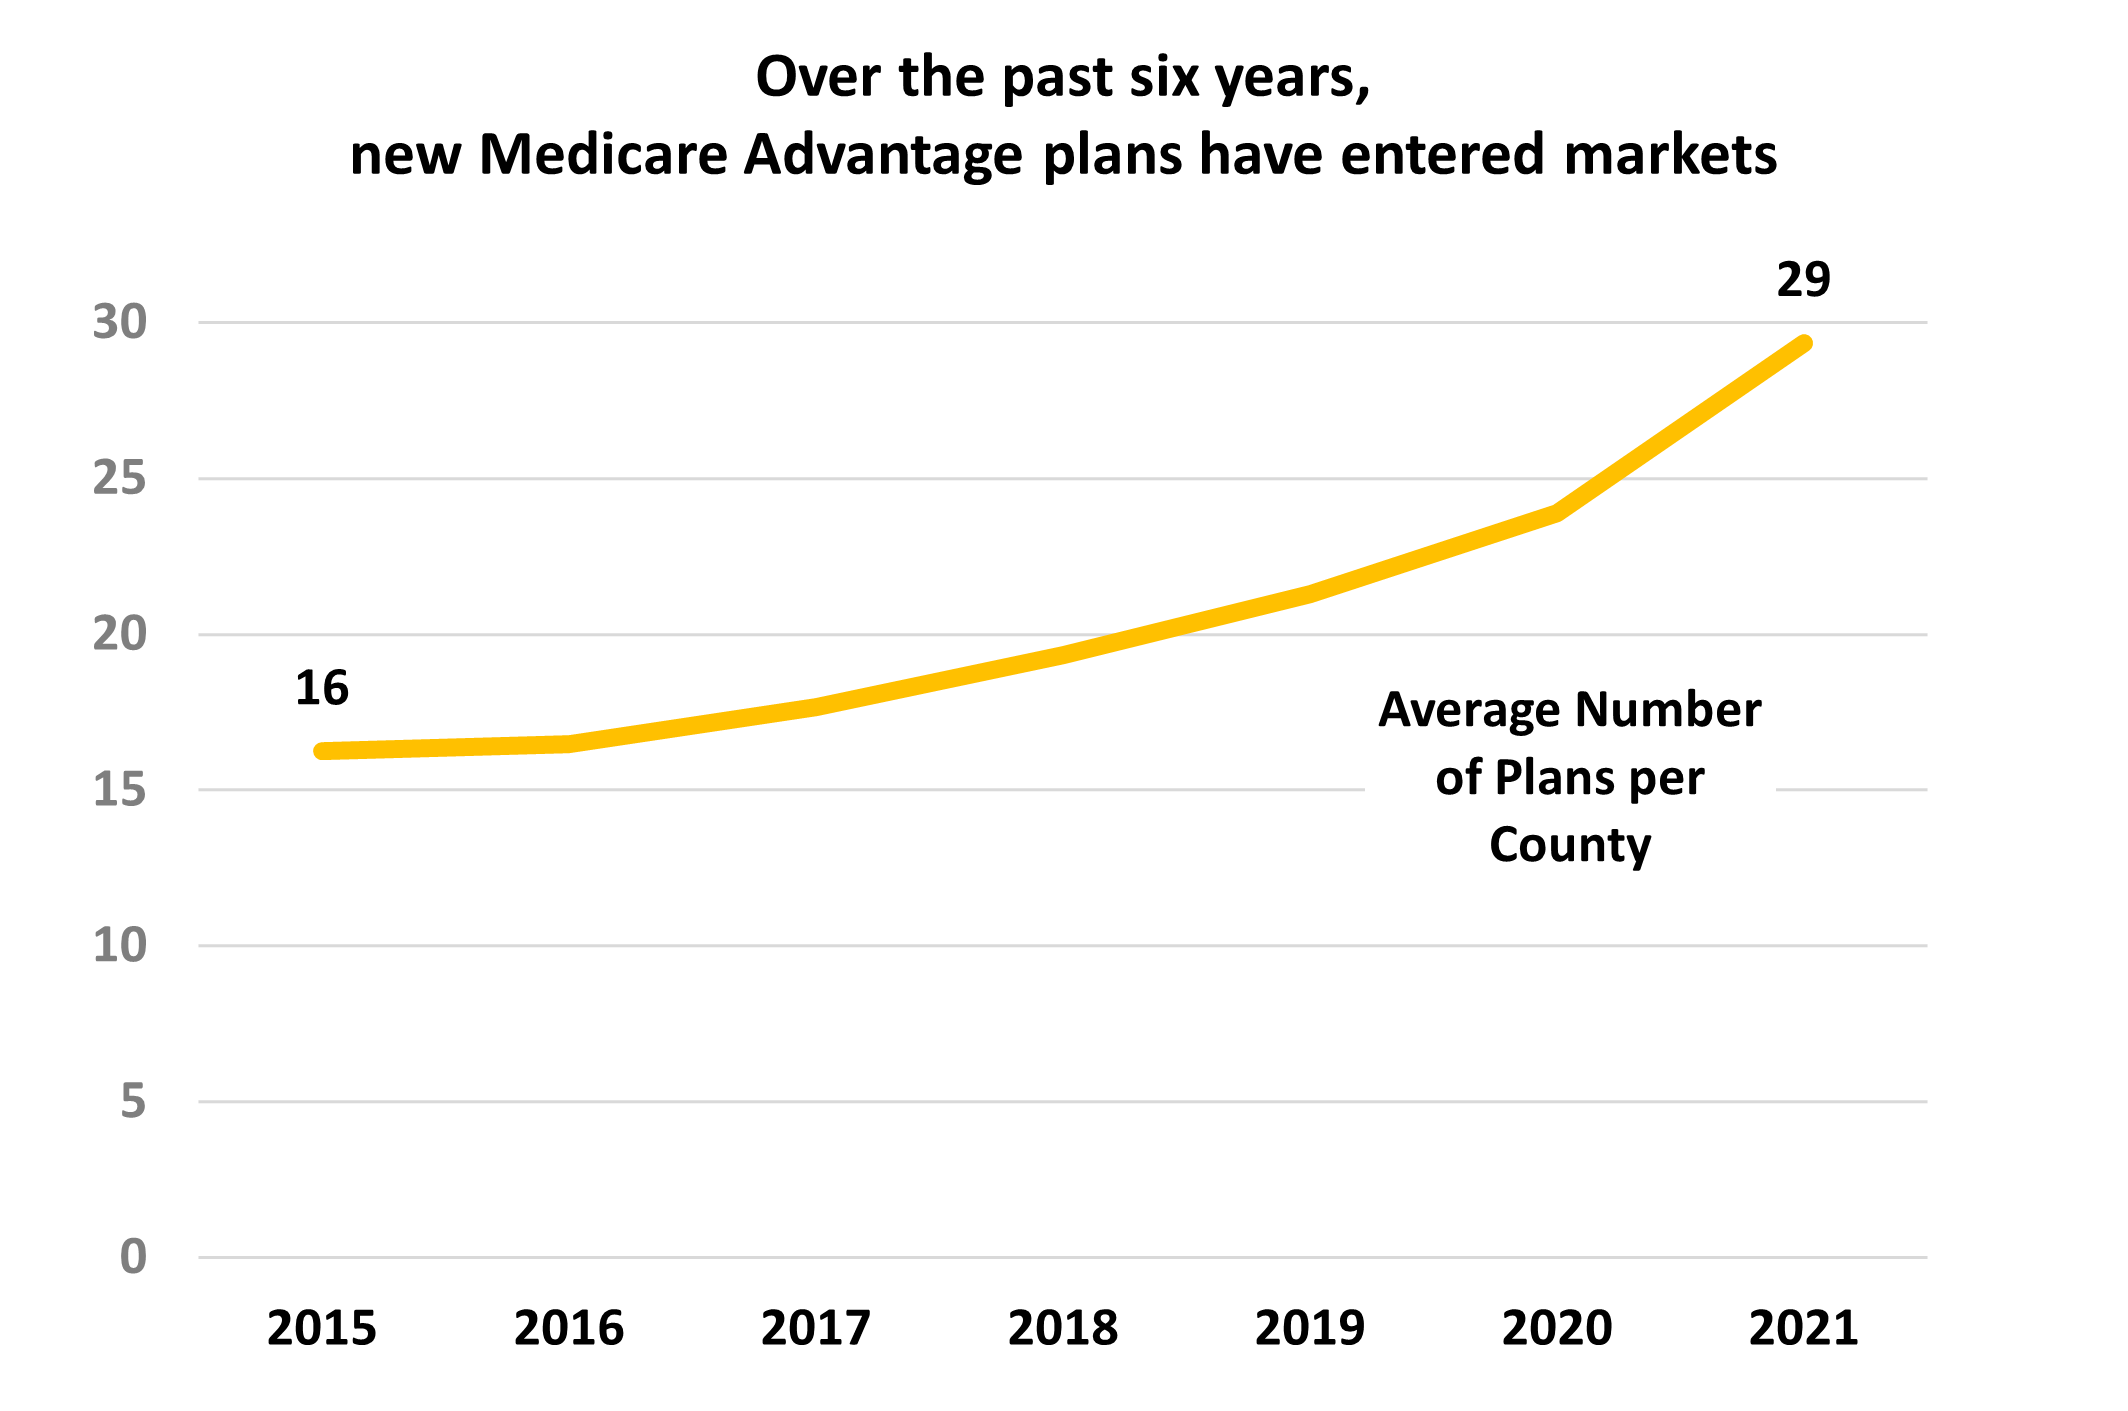
Competition within markets is also part of the equation. Over the past six years the number of MA plans offered per market has jumped from an average of 16 plans per county to 29. Within these crowded markets competitive marketing, advertising, and agent outreach has left few consumers without an opportunity to consider the MA program.

Enhanced benefit design and intensifying competition have pushed MA enrollment into a trajectory that appears to have momentum into the next decade. Health plan marketers are using every tool to find and enroll the last possible person.
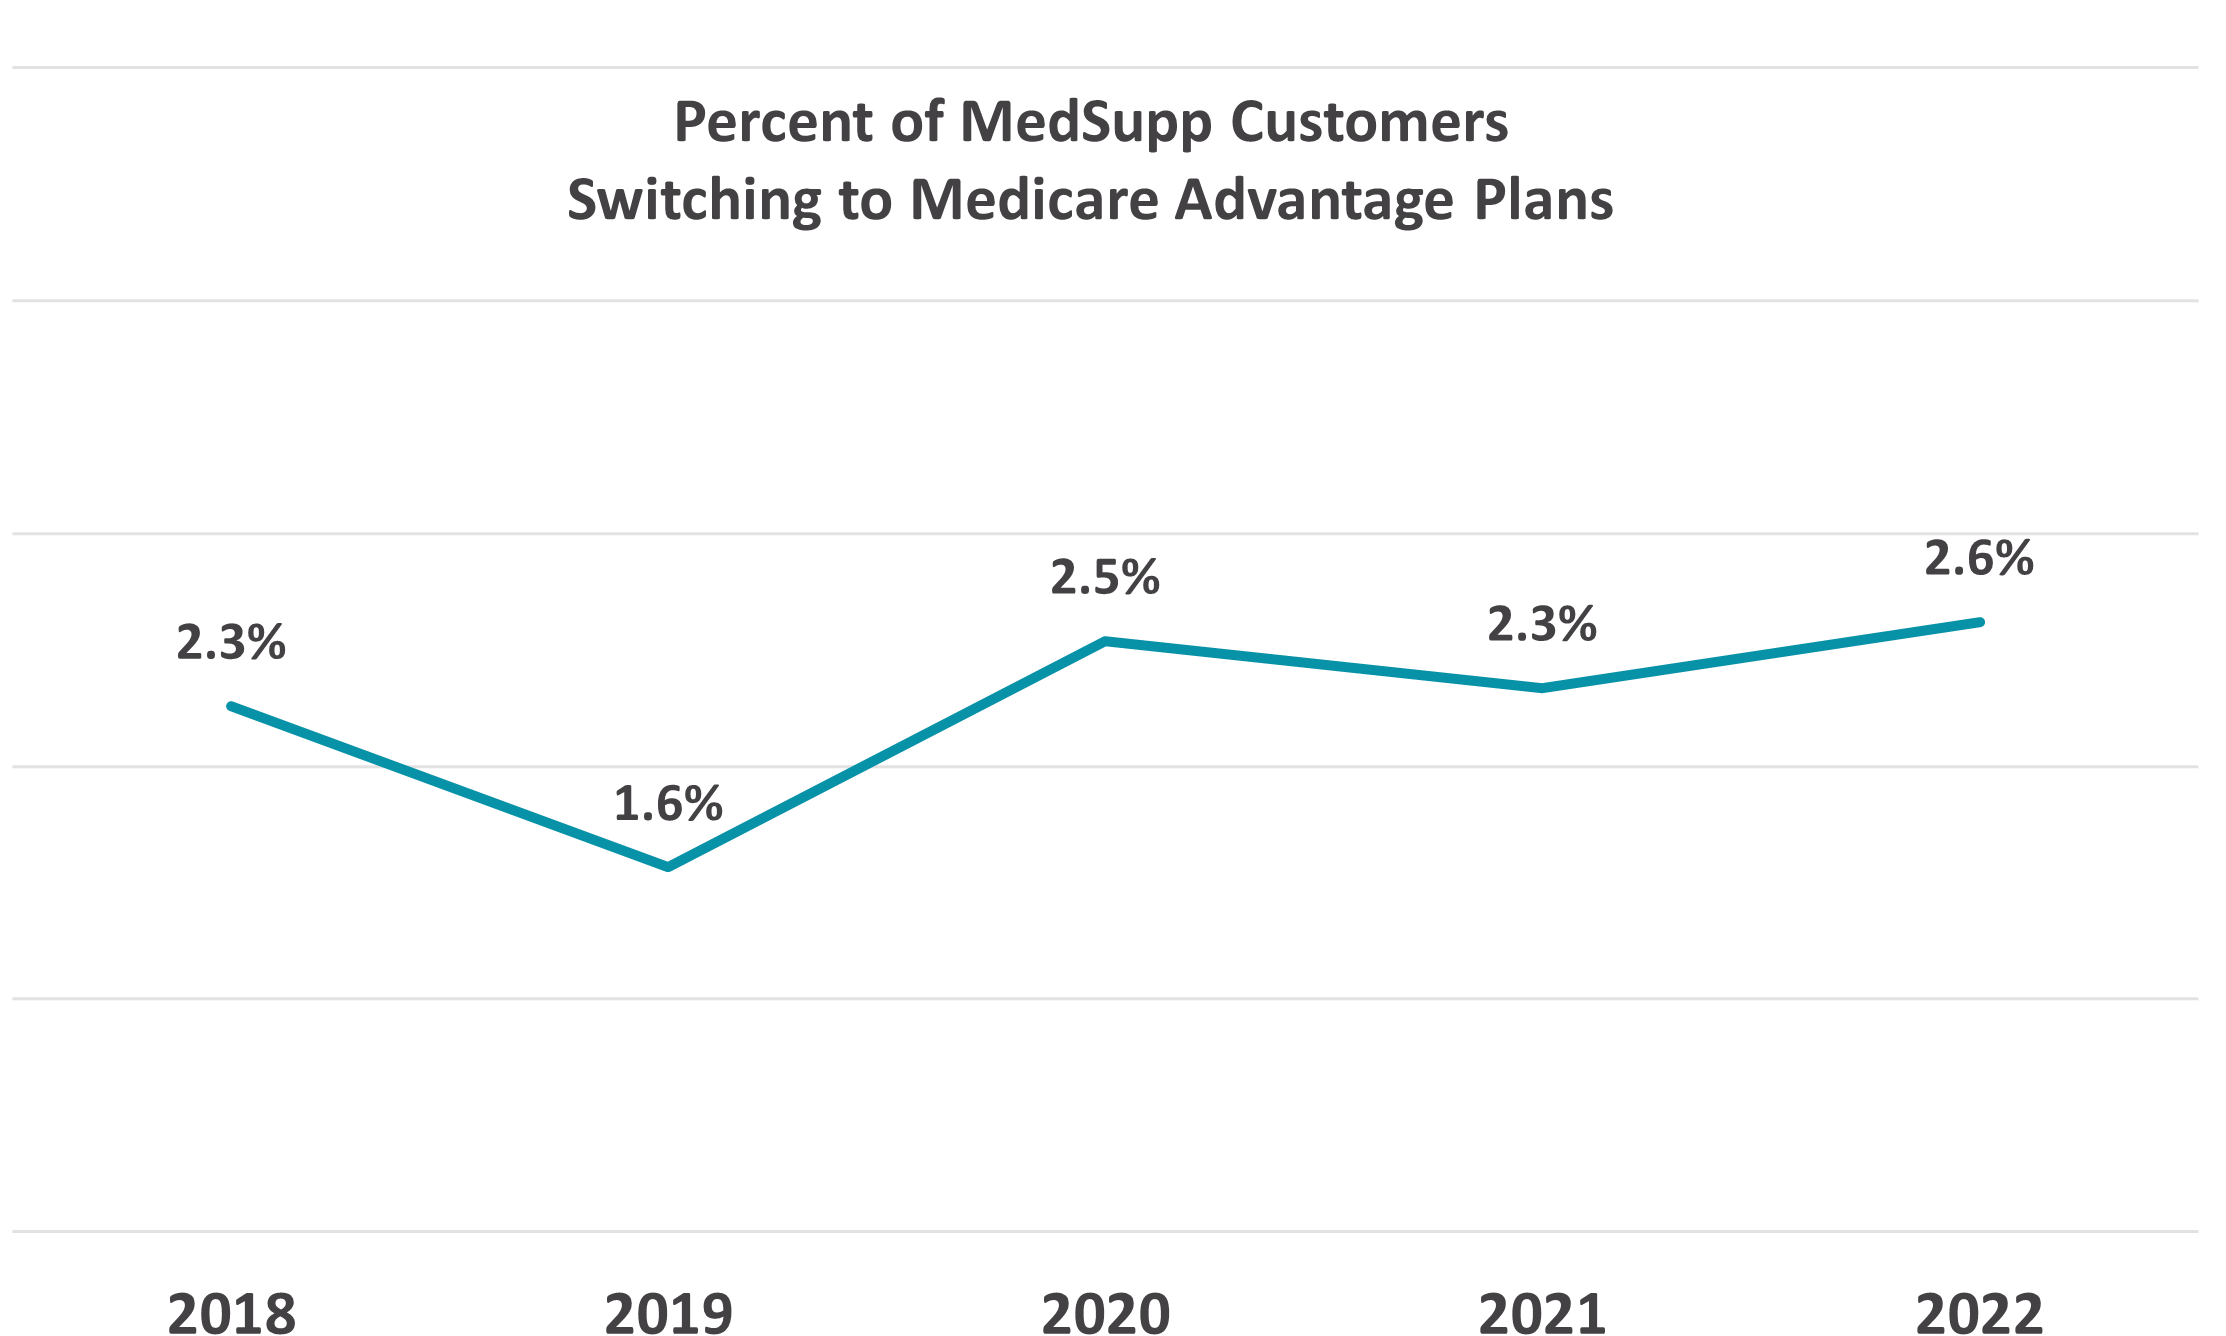
The proportion of MedSupp beneficiaries who switch to MA during the fall Annual Election Periods (AEP’s) been a small but steady source of new MA enrollees. During the 2022 AEP, Deft Research’s Medicare Shopping and Switching Study found that an estimated 2.6% of MedSupp customers switched to MA for the plan year starting January 1, 2022 or roughly 290,000 people. This is more than twice the number switching in the other direction, or from MA to MedSupp.

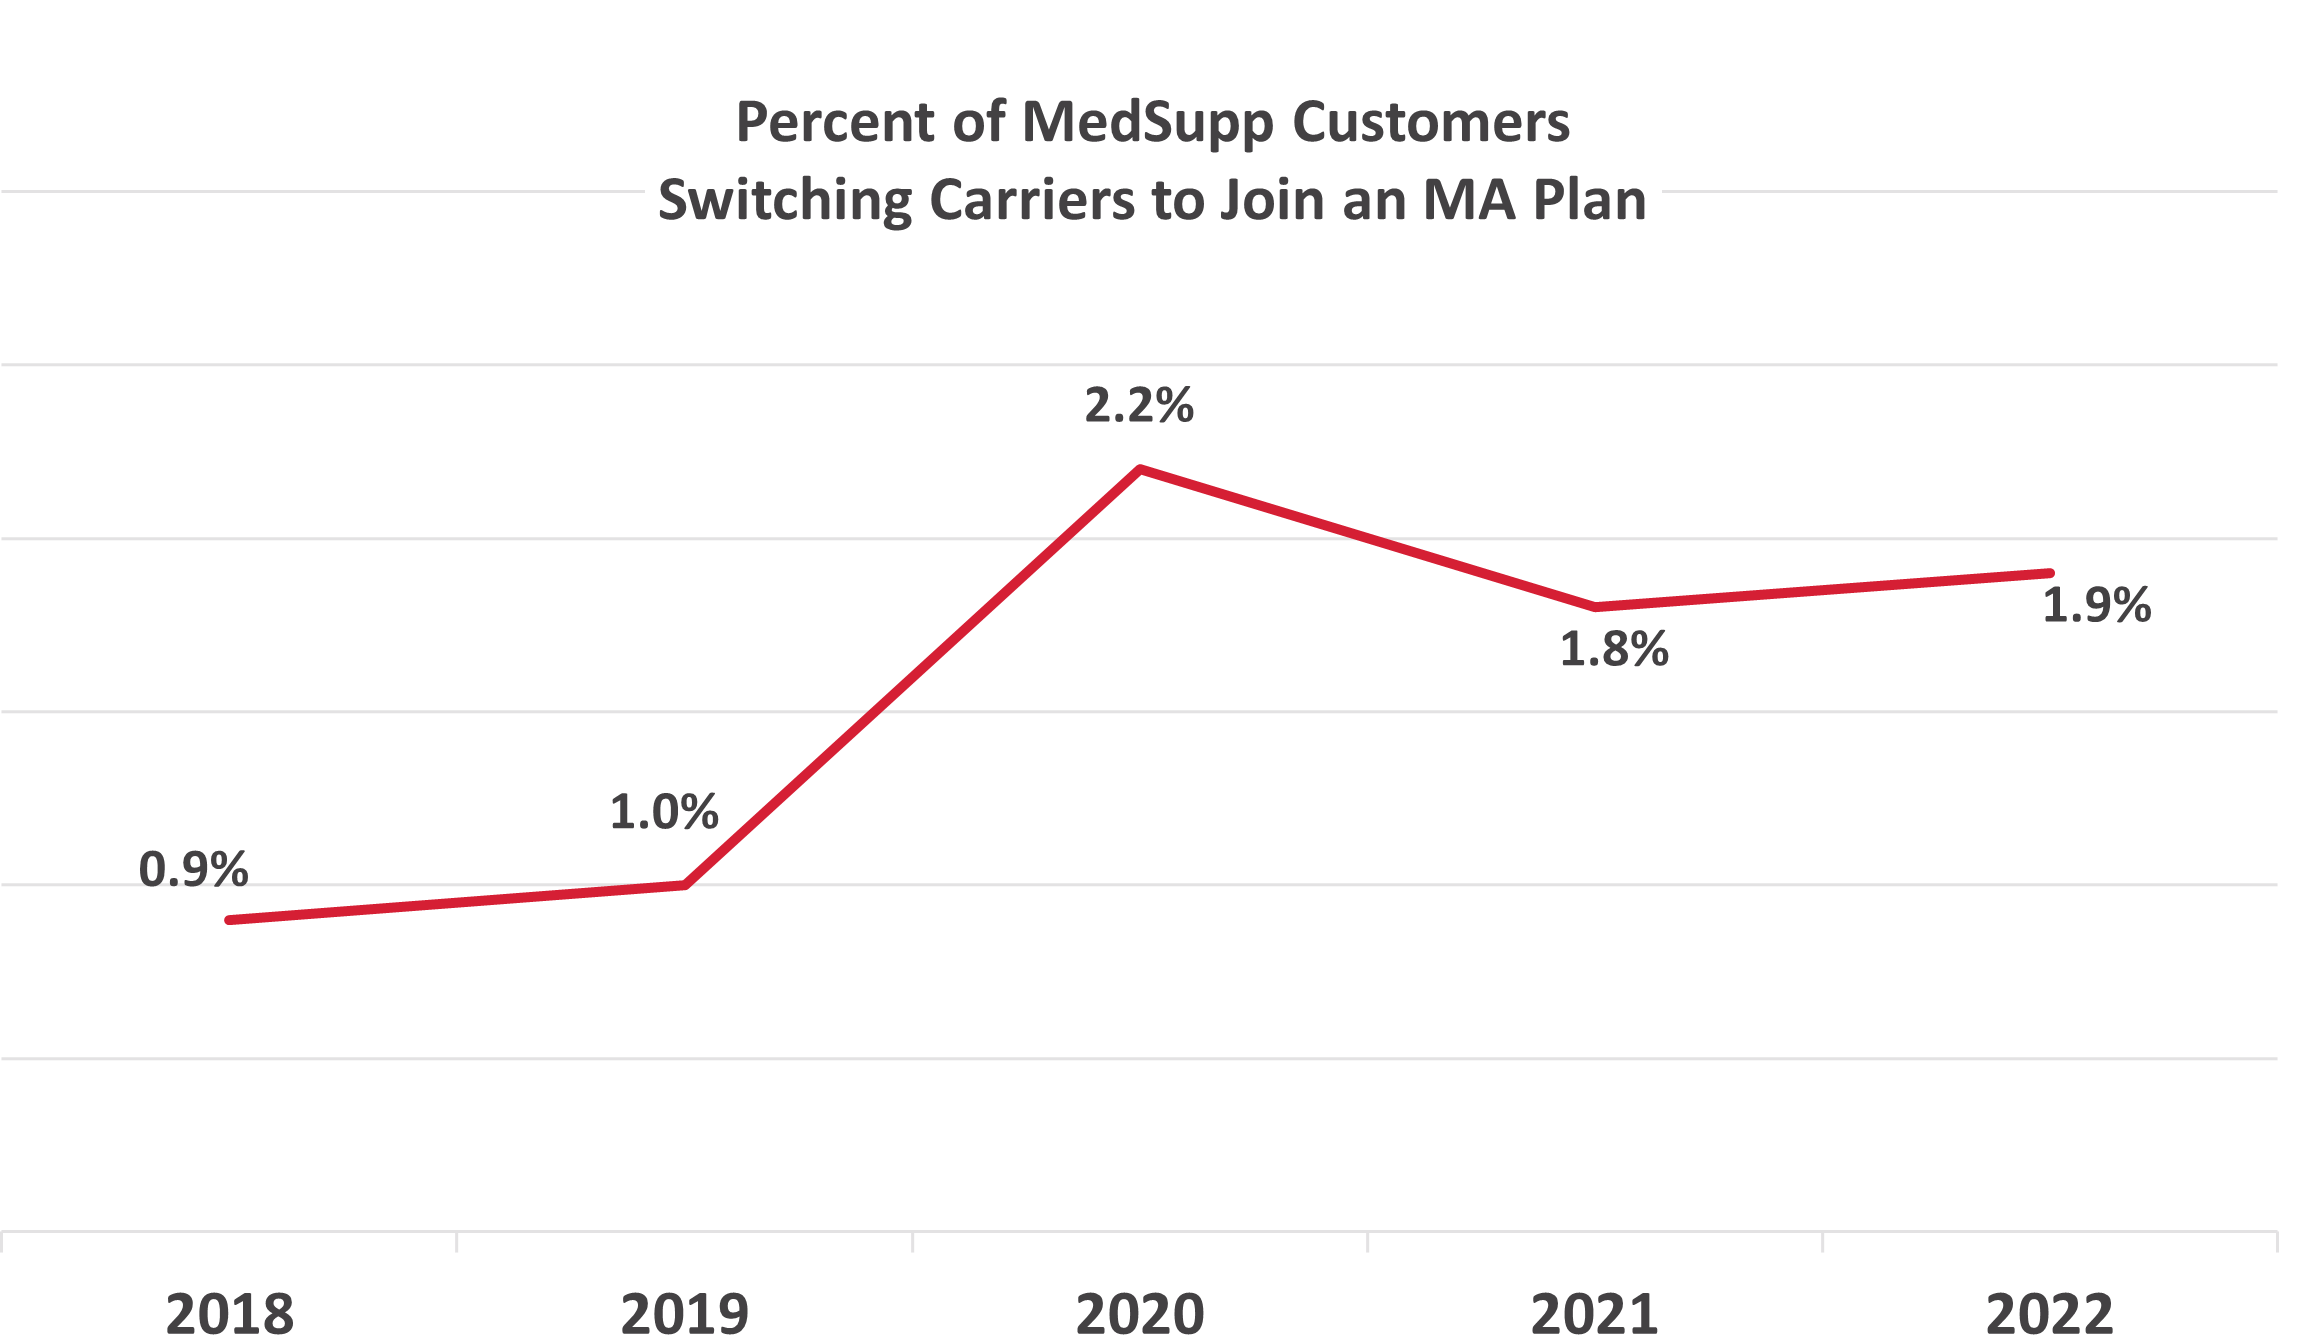
MedSupp to MA switching is largely accounted for by those who switch carriers when moving to MA. And this number has grown significantly in the past four years. During the 2022 AEP, just under 2% of MedSupp respondents indicated changing insurers and picking an MA plan, compared to about 1% in 2019. The upshot: few MedSupp members keep their insurers when moving to MA.

The carrier switching phenomenon may indicate that a significant event such as the death of a spouse, change in financial status or residence, appearance of a caregiver on the scene, or the development of overall dissatisfaction with the insurance company must occur before the former MedSupp beneficiary is released emotionally from their loyalties and energized to find something new.
Medicare Advantage enrollment growth continues to have momentum because its benefit package has many appealing features — supplemental benefits being the one emphasized here, but premium, combined medical and drug coverage, broad PPO networks, dental and vision benefits, all combine for effect. Enrollment growth is also propelled by the effective marketing resources being put into play.
Research has shown that MedSupp consumers are most concerned with access to medical services and pharmaceuticals and that they distrust network-based MA plans. In order for MedSupp beneficiaries to consider an MA plan, the network has to be addressed. Broad PPO’s are essential for the consideration to move forward.