Michael Blix, Sr. Director of Research and Analytics –
Leveraging Conjoint Analysis Under Reduced Reimbursement Pressure
The better-than-anticipated 2027 final MA rate likely has many in the industry feeling a sense of relief, but it could also point to last-minute revisions to bids. Even if plans are content with their 2027 design approaches, the 2.48% final rate certainly allows for more benefit design approaches going into 2028 than the preliminary 0.09% rate released back in January. Fortunately, there are research tools to help successfully navigate complex and hectic bid development cycles. Conjoint analysis provides the gold standard for bringing a data-driven benefit design approach for MA and commercial plans alike.
What is conjoint analysis?
Conjoint analysis is a quantitative market research method that measures how consumers make trade-offs when making complex purchasing decisions. Survey respondents are taken through a series of shopping exercises in which they are asked to select between different configurations of products, in our context, health insurance plans. The patterns that emerge from these choices (what features consumers are choosing and what they are avoiding in combination with other features) allow us to build a statistical model of consumer preference. With that model, we can simulate how preference for health insurance products may shift, given changes to specific benefit levels.
How carriers use conjoint to make smarter decisions
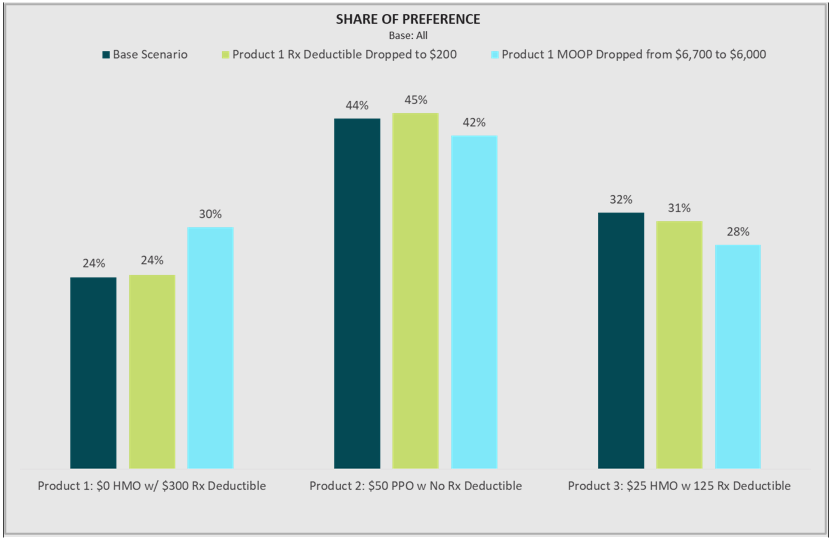
End users of conjoint data are often interested in simulating competitive scenarios that show how preference shifts for a product if a change is made to one of the benefit levels. For example, using data from Deft’s National MedSupp and OMO to MA Conjoint Study, the figure below shows a three-product scenario in which a $0 HMO with a $300 drug deductible and $6,700 MOOP gains preference as that drug deductible and out-of-pocket maximum are lowered. Product teams will often use this iterative approach in consultation with their actuarial partners to design plans that are financially sound while still holding appeal to consumers.
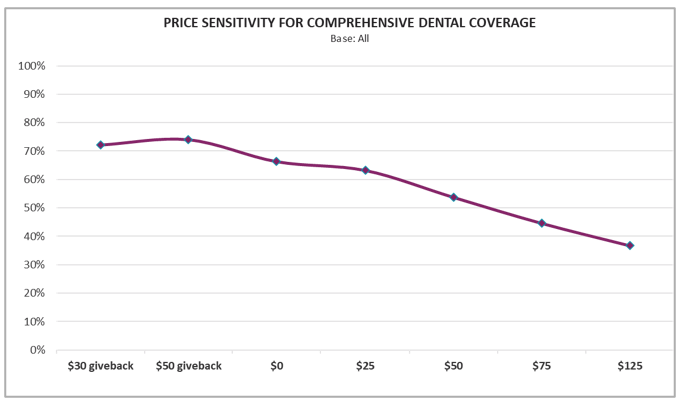
Another common approach conjoint users take is to produce price sensitivity curves for key benefits. For example, the figure below, also derived from Deft’s National MedSupp and OMO to MA Conjoint Study, shows how share of preference changes for a comprehensive dental benefit as premiums increase (relative to a nondental competitor, which is not displayed on the chart). Assessing the price sensitivity curves on key benefits is a useful boundary-setting exercise, helping plans identify the “sweet spot” in which consumers are willing to pay for the benefit up to the point where the price ultimately detracts from the benefit’s appeal. The curve below shows that a comprehensive dental benefit priced at a $0 premium has a clear advantage over a nondental competitor, and the benefit still gains the majority of preference up to about a $50 premium.
Using Conjoint Data to Segment Respondents
While iterative simulations and price sensitivity modeling are powerful approaches to data-driven benefit design, there is an additional level of insight to be gained from conjoint data through the segmentation of consumers. Users are able to compare simulation results like those above by things like demographics, health indicators, and coverage details, but any insight from those comparisons will be unique to those specific scenarios. To achieve a more generalized understanding of how different types of consumers’ benefit preferences vary, unique segments of consumers can be identified from respondents’ choices in the conjoint survey.
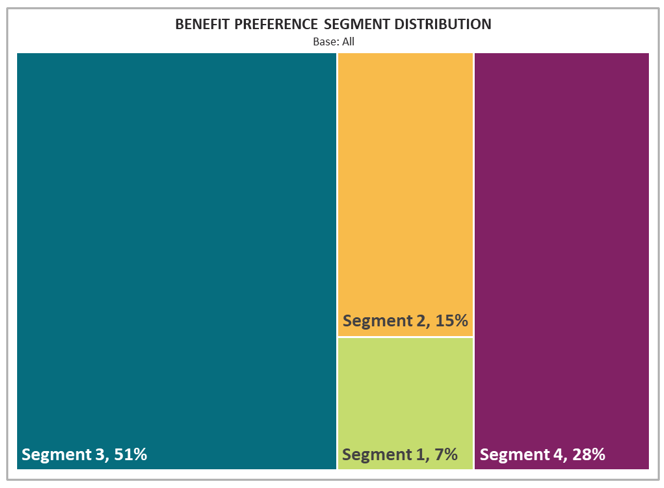
To illustrate, the National MedSupp and OMO to MA Conjoint Study yields a four-segment solution, with segments ranging in size from 7% to just over half of the MedSupp and OMO population.
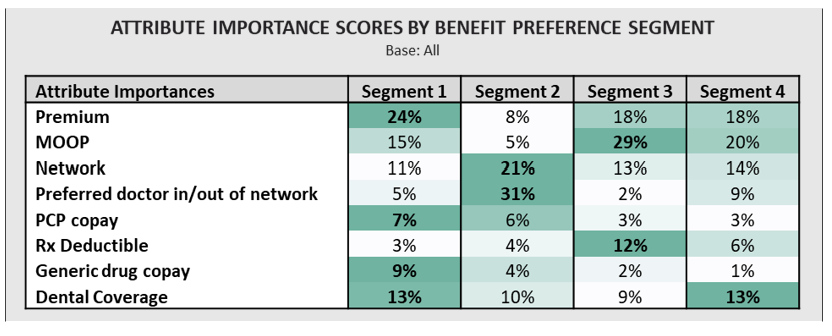
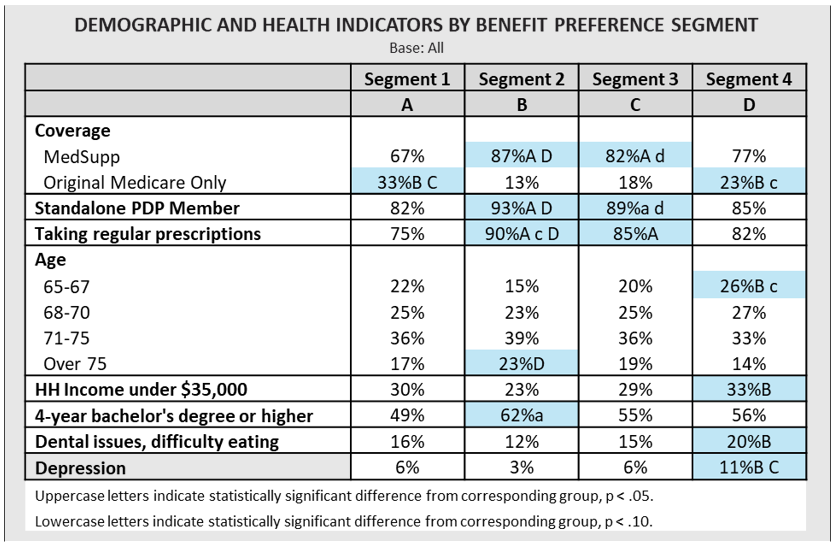
Segment 1 is the most price-sensitive and would be likely to avoid MedSupp look-alike MA plans. In addition. Segment 2 is primarily driven to purchase by provider access, with network configuration, provider continuity, and the PCP copay amount explaining most of their decision-making. The largest group, Segment 3, is much more MOOP- and deductible-driven than the other segments; they are the most willing to pay a higher premium to keep their out-of-pocket costs down. Segment 4 takes a more balanced approach, placing high importance on premium, MOOP, and network, but also prioritizing dental more than Segments 2 and 3. Understanding these sorts of nuances in one’s own market helps plans implement a targeted benefit design approach, which is critical for maintaining sustainable growth and bolstering retention.
As with any segmentation, it’s difficult to act on the results if the groups can’t be tied back to other identifiable features, such as demographics, claims data, or enrollment information. Access-driven Segment 2 members, for example, may be most effectively reached on a prospect list if targeting older, non-low-income seniors with higher educational attainment.
Conclusion
With somewhat higher MA reimbursement creating some room for bid design, plans that quantify consumer trade-offs now will be better positioned for any late 2027 adjustments and their 2028 strategies. Conjoint analysis is one of the best methods available for assessing consumers’ benefit preferences and anticipating their responses to benefit disruptions. Deft serves as a leader in performing conjoint analysis to help carriers fine-tune their bids. We offer different levels of ranging from “short-form” conjoint studies that provide users with incisive decision support under tight timelines, to full-fledged reporting with Deft insights and additional Deft+ consultative analytics.