In this article we discuss the challenges of using a health plan’s raw quality survey data to diagnose why quality ratings may be low and what can be done about it. We’ve developed a new methodology for diagnostic studies that increases the explanatory power of our research.
Background: Regulatory surveys such as Medicare’s Consumer Assessment of Healthcare Providers and Systems (CAHPS), and the Affordable Care Act’s Quality Rating System (QRS), are designed to deliver a set of metrics for health plan comparisons. Comparisons are used by health plans to identify areas for improvement and they are used by CMS to determine rewards for high performing health plans.
The Problem: While these survey systems accomplish a lot, they are not explanatory. They don’t lead users to an actionable understanding of “why” members rated their plans the way they did. Furthermore, they often fail to clearly suggest the “what” in terms of the best ways to implement improvement. Because the money and competitive advantages accruing to health plans with high ratings is significant, many health plans take an extra step in member research.
Deft Research’s solution to the problem of quality ratings explanation is the Quality Ratings Diagnostic Service. This service allows health plan managers to:
Quality Ratings Diagnostic studies are based on the idea that overall ratings such as the Overall Health Plan Rating, Likelihood to Renew a Plan, Likelihood to Recommend a Plan, etcetera result from the accumulation of past customer experiences. (Overall rating metrics are also known as Key Performance Indicators (KPI’s)).
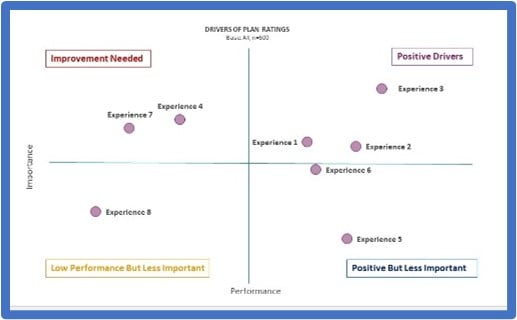
This concept gives us a research design based on explaining KPI’s with correlations to customer experiences. The strongest and most statistically significant correlations identify the most important customer experiences to improve if the health plan wants better retention and higher quality scores.
The Mix of Measures in Quality Rating Surveys. According to CMS, “CAHPS surveys are developed with broad stakeholder input, including a public solicitation of measures and a technical expert panel, and the opportunity for anyone to comment on the survey through multiple public comment periods.” The result is a survey that serves its standardized regulatory purposes. But the result is also a survey that is a mix of different measures — Yes/No questions, 4-point, 5-point, and 11-point scale questions. Questions with fewer response options, like “yes or no” or 4-point scale questions, produce less variability than questions with 5 or 11 response options.
The Consequence is Under-and Over-estimation. Analysis of standard CAHPS/QRS survey data will always underestimate the importance of those aspects of the healthcare experience that are measured with fewer response options and over-estimate the importance of those that are measured with more options. Correlating the combined varied scales of the standard CAHPS survey usually yields statistics that can explain about 30% of the variance in the Overall Health Plan Rating. That’s a fairly good result, and has allowed us to identify health plan priorities for improvement.
 An Improvement: A breakthrough occurred when we recently redesigned all of the CAHPS questions to use a single 11-point scale. When survey respondents were given the same scale to rate each of their experiences, our explanatory ability more than doubled; we have been able to explain up to 74% of the variance in the overall rating.
The rescaling means that a previous question that asked, “Have you ever had this experience: Yes, or No?” now becomes, “How often have you had this experience?” Survey respondents have the same number and range of response options for each question.
In addition to doubling the overall explanatory value, this new method reveals aspects of the health care experience which had previously been dismissed as low importance. Many experiences turn out to be much more important than previously believed.
Conclusion. By rescaling quality rating surveys for consistency, quality ratings diagnostic studies deliver information allowing health plan managers to delve more deeply and precisely into the drivers of KPI’s. The analysis enables better resource allocation for member experience improvements.