List Scoring
List Scoring Examples for Medicare and Individual/Family Plans
by Richard Hamer and Jordan SimundsonOur clients are asked to continuously improve marketing performance under ever changing competitive situations. To succeed, many health insurers score their prospect and member lists. Scoring a list can lead to better rates of return on marketing spend.
List Scoring uses propensity scores enabling health plans to prioritize prospects, leads, and existing members based on the likelihood of their behaviors. When health plans are guided by propensity models, they are able to more effectively aim combinations of products and calls‐to‐action at the consumers most likely to be receptive; money is spent more effectively, and sales goals are more likely to be achieved.
For example, one of our most frequently used propensity scores tells health insurance marketers how likely it is that consumers will prefer an MAPD over a Medsupp insurance product. We have created the Propensity to Choose Medicare Advantage model based on our survey data and an extensive analysis of local market and neighborhood characteristics. With these scores appended to lists, marketing campaigns can be set up to target consumers with insurance offers that match their preferences. Below is an analysis of a health insurance marketing campaign showing list scoring performance.
Propensity to Choose MA Scoring Performance
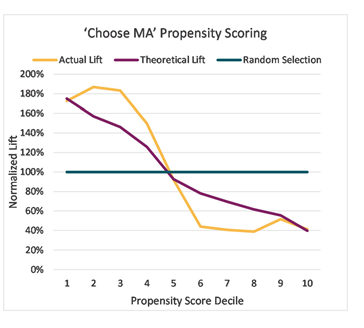
The graph above shows the real results of a health plan campaign. The yellow line shows that consumers who were estimated by the Propensity to Choose MA model to be most interested in MAPD products, responded to targeted MAPD messages at a rate that was 80% higher than a campaign where every consumer was included (this is referred to in the graph as ‘random selection’). The graph also shows that the theoretical performance and the actual performance were similar. The similarity means that health plans can confidently use theoretical expectations in their planning. In this case, the expected performance tells marketers to limit marketing spend on consumers whose MAPD propensity is not in the top five deciles of scores.
Several Propensity Scores for Medicare and Individual/Family Related Insurance are Available
- Propensity to Choose MAPD
- … to Choose $0 MAPD
- … to Choose MedSupp
- … to Choose a High dollar MedSupp product
- … to seek health insurance through an ACA product
- … to Work with an Agent
- … to Respond to Direct Mail
Can the models be combined for better results?
In many cases yes. One approach is to multiply the propensity scores of two consumer behaviors. For example, ‘Choose MAPD’ and ‘Respond to Direct Mail’ scores can be multiplied to produce a third combined score. With the new score, the best prospects can be targeted with direct mail while marketing resources are re-directed for the worst prospects to MAPD direct mail. Below is an example of real results when a health plan did this.
Campaign Performance when ‘Choose MAPD’ and ‘Respond to Direct Mail’ Propensity Scores are Used Together
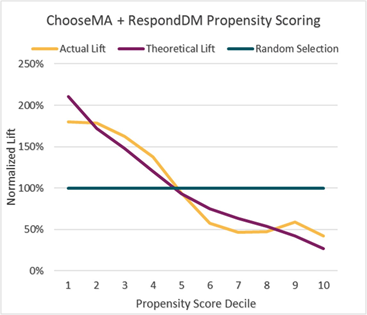
In this case, using the two scores together, generated an initial theory (expectation) that was closer to the eventual results. Meaning, in this case, the health plan’s marketing plan and budget turned out to be right on the mark.
Geo-Targeting
While Deft’s list scoring service uses prospect and demographic data to produce propensity scores, we can also create propensity scores based on location only (County, Zip Code and Census Tract). The scores can be licensed for a client’s specific service area or expansion markets and do not require any PHI or PII to be disclosed. Deft’s geotargeting solutions are based on clustering of like Census Tracts across a number of neighborhood attributes and can be easily customized to reflect a client’s specific experience with their unique products or marketing efforts.
Set up a preliminary evaluation.
Because the Deft models use geo-targeting, we can provide a preliminary evaluation of the effectiveness of models without requiring any personally identified data. All we need is the Zip+4 for each of your prospects and members.
What about ACA coverage or Supplemental Insurance?
Deft offers models that help target potential ACA or stand‐alone Supplemental Insurance members. These models help plans filter out households covered through employer coverage and focus on those who are in the market for Individual coverage, either subsidized or non‐subsidized, or a stand‐alone supplemental insurance plan.