Research for Diagnosing CAHPS and QRS Ratings
by Richard HamerHow Research Results Help Health Plans
Regulatory surveys such as Medicare’s Consumer Assessment of Healthcare Providers and Systems (CAHPS), and the Affordable Care Act’s Quality Rating System (QRS), are designed to deliver a set of metrics that allow health plan comparisons.
While these survey systems accomplish a lot, they do not explain the “why” behind members’ responses. Because the money and competitive advantages accruing to health plans with high ratings is significant, many health plans take an extra step in member research. They commission Quality Ratings Diagnostic research allowing them to:
- Identify areas of member experience which, if improved, would lead to higher CAHPS or QRS ratings.
- Understand member characteristics that are associated with higher or lower quality.
- Develop a better sense of what causes members to leave the plan.
Deft designs and fields efficient surveys that identify the key drivers of plan CAHPS and QRS ratings. As a bonus, Net Promoter Scores (NPS) are usually included in the analysis.
Information Delivered
Both Medicare’s and the ACA’s quality rating systems give great weight to member experience. And most of the measures for member experience come from surveys. But the surveys are descriptive, meaning they provide a picture of a health plan’s performance. They are not explanatory, they do not help their readers understand why member responses are too low to achieve the best ratings.
The chart below shows how negative experiences translate into low quality ratings.
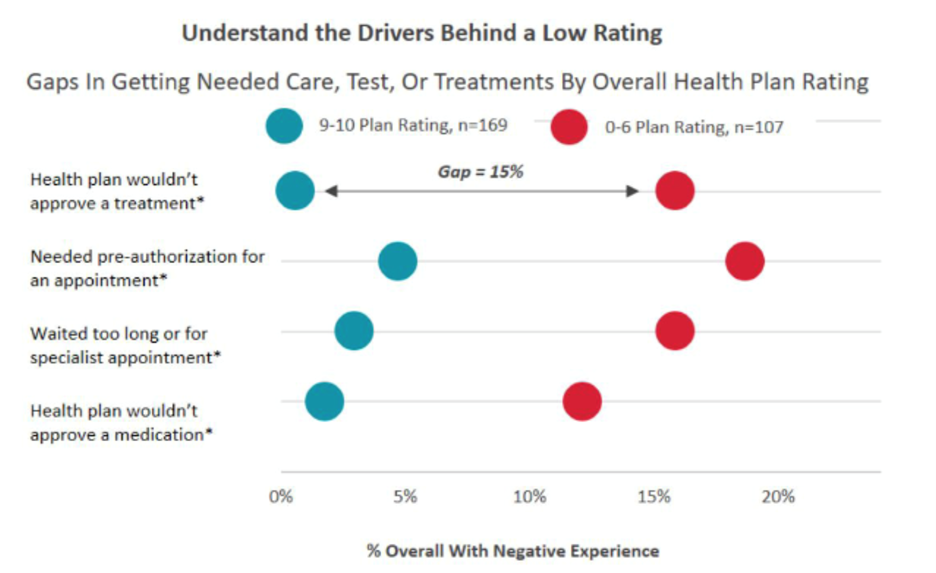
The chart shows that members who rated the plan a 9 or a 10 overall did not experience treatment denials, pre-authorizations, long waits, or drug coverage issues. Conversely, members who did experience these problems generally gave their health plan overall ratings between zero and six.
Benefits to Clients
With this kind of information, health plans are able to see where investment in member experience improvement will do the most good – they can see the number of people whose experience will be improved, and assess what the improvement will do for the health plan’s quality ratings.
Some of the areas where we have seen action focused:
- Varying responses from geographic regions have been addressed – clients have realized that services delivered to the population of one region have been less satisfactory than services delivered elsewhere.
- The communication of Explanation of Benefits, both in print and verbal, has been improved.
- Cost sharing surprises – for both medical services and drugs – have been minimized through better communication both written and verbal.
- The impact of telehealth services on member satisfaction has been measured and findings have guided investment.
Conclusion
Quality ratings diagnostic surveys boil the complexity of health plan operations down to a manageable set of issues on which to focus. The results help the health plan’s managers work together to develop priorities for member experience improvement. When clients do diagnostic surveys over more than one year, trends in these key areas help gauge the effectiveness of past efforts.